Range
Tree range maps for North America are the result of a monumental project by Elbert Little, Chief Dendrologist of the United States for 34 years. He used a combination of historical accounts and herbarium specimens to build on the work of George Bishop Sudworth and Charles Sprague Sargent to create a 6-volume Atlas of United States Trees.
Little's goal was not to map where trees were found currently, but where they might have been found before Europeans began moving trees around the landscape. Although foresters often accept Little's range maps as an accurate representation of the range map, there is no way to know how accurate they might have been.
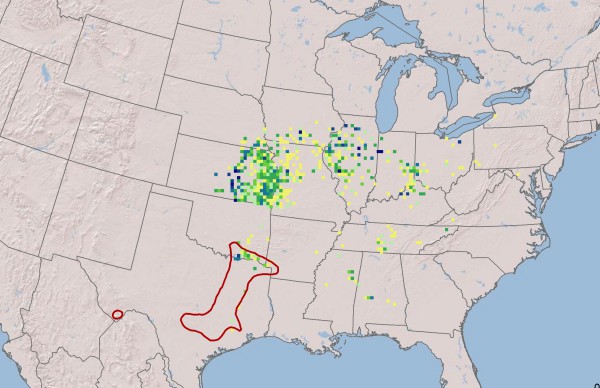
Osage-orange provides a good example of this problem. Little's reconstructed range put Osage-orange within a bone-shaped range in Texas, Oklahoma and Missouri, with an outlying population in west Texas. By the time he did this work, though, Osage-orange could be found throughout eastern North America. There is no way to know how accurate this map might be.
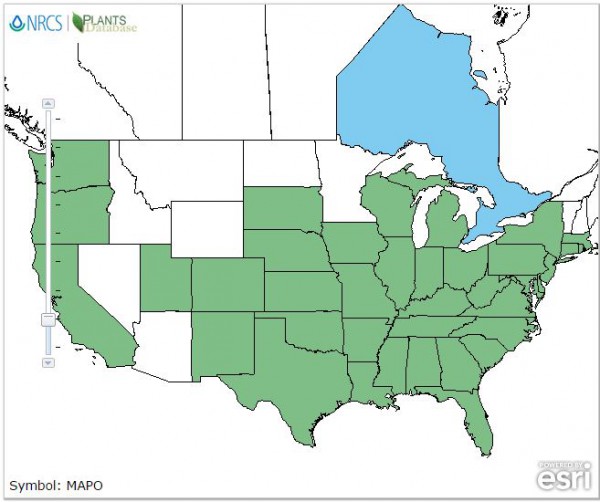
The USDA Plants database ignores attempts to reconstruct original range and instead uses current observations to show where the tree might be found today.
Find Little's range maps here. The USDA Plants database maps current range.
Importance Value
Importance Value is a measure of how dominant a species is in a given forest area. It is a standard tool used by foresters to inventory a forest. Foresters generally do not inventory a forest by counting all the trees, but by locating points in the forest and sampling a specified area around those points. Three kinds of data are collected:
- Relative frequency, the percent of inventory points occupied by species A as a percent of the occurence of all species. If species A is found in 5 out of 8 sample points, its relative frequency is 62.5%
- Relative density, the number of individuals per area as a percent of the number of individuals of all species.
- Relative basal area. the total basal area of Species A as a percent of the total basal area of all species. Basal area is the sum of the cross sectional area of all the trees of species A, measured at 4.5 ft. above ground. The forester actually measures diameter and then converts that number to basal area.
Each of these values is expressed as a percent, and ranges from 0 to 100.
The Importance Value is the sum of these three measures, and can range from 0 to 300.
A high importance value indicates that Species A is well represented in the stand because of some combination of a) a large number of individuals of Species A compared with other species in the stand, or b) a smaller number of individuals of Species A, but the trees are large compared with others in the stand.
Importance Value as used in this web site is derived from the USDA Forest Service Forest Inventory and Analysis Program. The Importance Value maps are available for download at USDA Forest Service Climate Change Tree Atlas by Anantha Prasad, Louis Iverson, Steve Matthews and Matt Peters. These Importance Value maps are for the United States east of the 100th meridian.

